I touched on this issue over at Econlog, but I’ll try again here in slightly a different way.
The original Phillips Curve from 1958 had nominal wage inflation on the vertical axis. (Actually the original original PC was developed by Irving Fisher in the 1920s, and used price inflation.) Then American economists switched to price inflation in the 1960s. In the 1970s and 1980s, economists accepted the Natural Rate Hypothesis and the expectations-augmented Phillips Curve was developed:
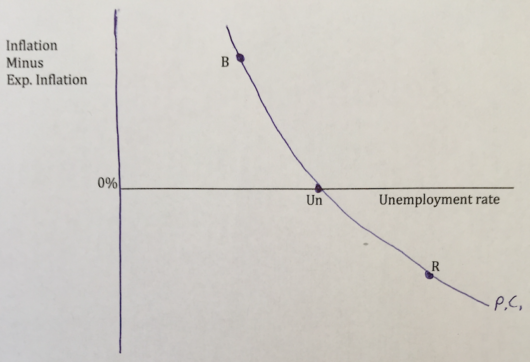 When inflation is higher than expected you are in a boom, and when it’s lower than expected you are in a recession.
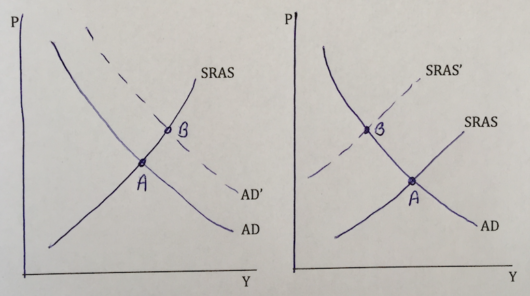
But inflation probably not the right variable, for standard “never reason from a price level change” reasons. Higher inflation can reflect more AD, or less AS:
 So what is the right variable? As far as I can tell, the Phillips Curve should be using unexpected changes in NGDP:
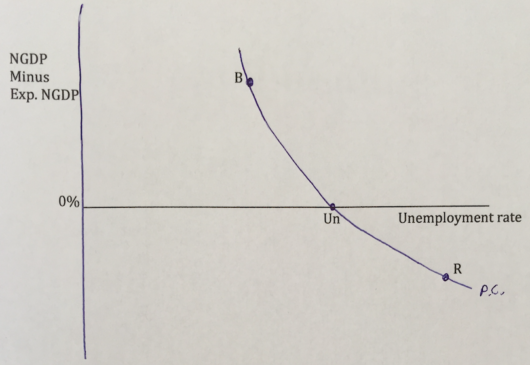 So here’s my question to economics instructors. Suppose you have an advanced topics chapter at the end of macro 101, which covers the standard Phillips Curve (using inflation), and discusses the Natural Rate Hypothesis and the importance of expectations. Would it be acceptable to have a section at the very end of that chapter with the final two graphs shown here? I.e., the two AS/AD graphs to show students the downside of using inflation as an indicator of whether the economy is overheating, and the NGDP version of the Phillips Curve to explain to students why more and more economists favor NGDP targeting.
Or is there something I am missing, which makes NGDP unsuitable for the vertical axis of a Phillips Curve?
PS. The principles textbook I’m working on will be ready for consideration later this year, available for use in classes in the fall of 2019.